Working with color schemes in F#
While creating some visualizations, like a choropleth map, we often rely on color schemes provided by the library. When we use those libraries, palette adjustment is possible but not necessarily in a domain-friendly way.
I really like the entire d3js with its color interpolations or scale-chromatic functions. You can check sample “palettes” here: d3js color schemes , including cyclical and categorical schemes.

All we have to provide is a ranked value between 0 and 1 to obtain adequate color.
In general, we could port that functionality to .NET directly (or maybe it already exists?).
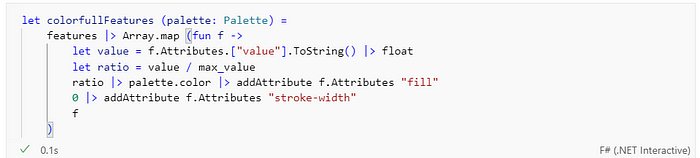
But if we wanted to use just a smart portion of it inside our analytical workflow we can implement it with just one Discriminated Union definition:

(* this is just a Notebook sample, if I wanted to write it as a package, DU would look slightly different with a helper module instead of putting everything inside a single DU)
and use it as follows:

Let’s see a full example of geojson processing file.
I will use NetTopologySuite for features/geometries processing and MathNet.Numerics for ranking values.

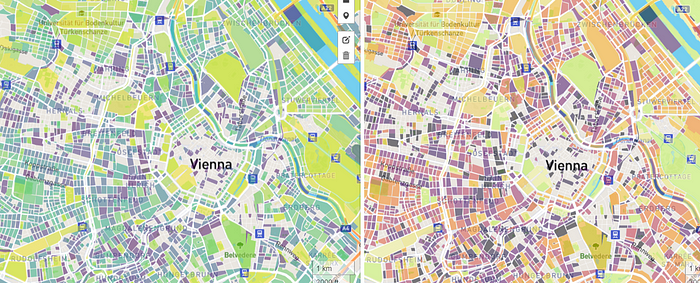
As a data example I‘m using trees distribution in Vienna (count of trees in a particular city block is placed in “value” property):

Now I will rank the values to convert them to [0;1] range and to have more gradual color transitions.

However, depending on the scenario, it may be simpler to just use “value/max” for the same purpose and keep the real color distribution between polygons:
Finally, let’s choose the palette and do something with the results. Here I will just store the colored polygons in a file.

You can process the data further according to your domain needs, as a summary I will just use one of vscode extensions to display the final geojson file or copy them to www.geojson.io
Remark: there are some empty blocks here but it is just a result of missing data in the source file.
Remark II: if published as a nuget package, palettes like those presented could be accessible from C# as well.